- Readers may be aware of my previous reports regarding
fairly well- timed, complex pulses of X-rays from our Sun. On February
22, 2008 I examined the timing relationship between X-ray, electron and
magnetic activities as observed by NOAA satellites. Some very interesting
facts came to light as a result of doing so.
-
- The NOAA proton activity chart is difficult to use for
this work and was not included. Proton measurements are essentially high
frequency noise. Finding clearly defined, fixed proton flux levels over
short periods of time is just not possible using NOAA data as it is provided.
-
- It is also important to use existing NOAA data exactly
as it is provided to prevent introduction of extraneous errors. One relatively
minor error was found when using magnetic field data as NOAA provides
it, and this will be discussed later.
-
- Partial confirmation of my time jump theory requires
evidence of other temporarily frozen activity, such as particle and magnetic
field levels. To do this, I compiled a composite chart with the best
temporal alignment possible as shown below:
-
-
-
-
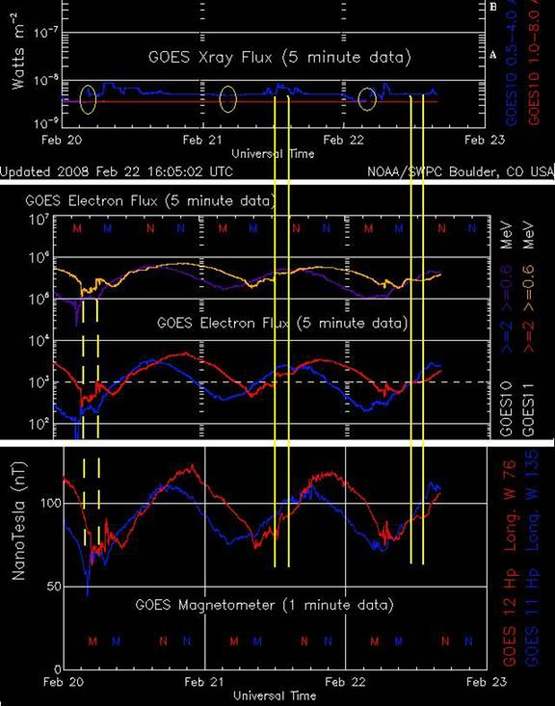
- CHART EXPLANATION
-
- I apologize for the apparent complexity of this chart
which cannot be helped. To assist the reader not familiar with what this
compiled chart means, an explanation is provided here.
-
- Three small, oval yellow circled areas on the top chart
segment show missing data on the red plot line. The red plot line represents
1.0 to 8 Angstrom X-ray activity detected by the NOAA GOES 10 satellite.
Missing data appears as small gaps in the red line. Reasons for these
gaps are not yet known. On February 22 I had a discussion with a long
time, highly reliable friend of mine also with a long history of engineering
NASA systems and ties to the space agency. He stated that recently NASA
recently stated they have no idea what's going on with the satellite.
They are not sure whether it's malfunctioning or not.
-
- It is also interesting that these gaps in the red plot
line for the longer X-ray wavelengths have occurred almost precisely 24
hours apart. Common sense tells us that satellite malfunction from a
failing part as a result of thermal stress or other typical failure modes
would not cause this to happen in such an accurately timed manner. The
GOES 10 satellite is always in direct sunlight and is not shadowed by
the Earth. If the GOES 10 was shadowed periodically every 24 hours by
any celestial body or even an asteroid, both red and blue X-ray plot lines
would be straight lines during this period. One might also expect a straight
to occur if ground equipment recording data was being replaced or the
signal was re-routed but not three times in a row, neatly spaced apart.
No, something else is happening here.
-
- Since the red plot line has remained a flat line for
more than a week, it may indicate several possibilities. Some of which
are:
-
- Longer X-ray wavelengths from the Sun really have essentially
dropped to almost zero (?)
- The X-ray detector for this wavelength aboard the spacecraft
has stopped working reliably. The red plot line has not been observed
to go flat like this by this researcher in more than 10 years of observing
these charts. But then neither has the blue plot line been near the bottom
of the chart remained like this for such a long time.
- Data for the longer X-ray wavelength (red line) is off
the chart, from events which spiked so high or low that the event is off
the chart's scale. Since the blue line for shorter X-ray wavelengths has
also shown extended lower X-ray levels, it would seem unlikely that the
plotted data for longer X-ray wavelengths has spiked off the top of the
chart.
-
-
- As we can see in the center chart, electron flux normally
runs in a sinusoidal (sine wave) pattern similar to the same way all human
beings breathe. Along with the magnetic flux and electron flux from the
sun appear to track in phase with each other . Perhaps the sine wave is
a basic signature of a life cycle. One complete sine wave cycle on the
Sun appears to have a 24 period. I don't know of any scientist that has
determined why this occurs, but perhaps it has something to do with the
rotation of the Earth involving a complex relationship with the Earth's
rotation. This on-going sine wave historically has appeared to run almost
continuously and might even be the result of the Earth's rotation. Is
it merely a coincidence that it has a 24 hour cycle?
-
- UNEXPECTED ERROR
-
- Compiling this data into one chart resulted in an unexpected
error. Vertical white date lines provided by NOAA for each chart aligned
fairly well with the top two charts. However, there is a slight horizontal
linearity problem with the magnetometer chart as provided by NOAA (bottom
segment.) In light of this, the pair of yellow dashed lines can only illustrate
approximate temporal (time) alignment for the three measured energies
for the date of February 20. There is a similar slight misalignment for
Feb. 22, too.
-
- OTHER OBSERVATIONS
-
- I have added vertical solid yellow pairs of lines to
indicate segments of time where the wave activity appears to essentially
"freeze" at whatever level it is currently at, for three hours
or less. This appears as a horizontal line in each chart, instead of
displaying the usual sloped or changing energy levels. Looking at the
chart plots between the yellow lines for each flux level demonstrates
this effect. If electron and X-ray show a constant intensity, then it's
quite logical that the visible white light level we see with the naked
eye could also freeze at whatever level it might be at for that period
of time. However, it's quite difficult to make such an observation on
Earth to detect this unless:
-
- A calibrated light meter is used which is not saturated
in sunlight, connected to a computer or a data acquisition system
- This test is done on an absolutely sky-blue clear day
with no clouds or haze
- No chemtrails have been sprayed for several days
- You would need to have the above conditions present throughout
each full day.
- Needless to say, finding a place to meet all these conditions
on Earth is very difficult to say the least.
-
- In the center of the frozen waveforms, there appears
to be a small "blip" in the magnetic field (see bottom chart)
while the other energy levels hold almost constant.
-
- Note that these temporarily frozen energy levels do not
imply that the Sun simply "stopped working" for those frozen
periods of time. An hour without sunlight would have panicked half the
people of Earth who were in daylight in the western hemisphere if the
Sun simply went black and "came on" again. For the other half
of the world on the night side, the full Moon and partial full Moon at
night on these dates would appear to black out and come on again as though
it was switched off and back on again. Of course, none of this happened.
-
- Why do these energy levels suddenly freeze and then start
varying again? It's not likely to be the result of the "Solar Heartbeat"
which is known to have a 16 month cycle. Perhaps one answer is that a
time jump took place. During a time jump, it may be that everything freezes
at whatever energy level it's at during the jump. Perhaps this isn't just
a phenomenon of the Earth jumping. Maybe this jump involves our entire
Solar system, or perhaps the entire galaxy or universe. Astronomers would
most likely just laugh at this idea but then they also laughed at
Galileo and many others like him, too.
-
- If our solar system, galaxy or universe has time jumped
it could be the biggest discovery of all time. Perhaps this is the result
of a black hole being destroyed, which sends out a time wave for many
light years. It's well known that the event horizon of a black hole would
cause serious distortions to space and time. A time wave may not have
distance limitations, and the effect could be almost instantaneous.
-
- HELP FROM THE STARS
-
- It would be wonderful if there was a technology that
could allow us to monitor just one or two other stars at the same time
we monitor our Sun for electron, X-ray and magnetic activity, it could
give us more conclusive evidence. There is one such technology - the Chandra
X-ray satellite and others owned by NASA. Launched many years ago, Chandra
and other science satellites might provide the needed data to prove my
theory. To do this requires an accurate knowledge of the exact distance
from the star to the telescope to take a time shift into account.
-
- In theory, X-rays travel at the speed of light. Calculating
for certain the exact distance to the nearest star is not a trivial undertaking.
Just thirty years ago, everyone thought Alpha Centauri was the closest
star at about 100 light years from Earth. Now it's believed the closest
star to Earth is about 5 light years away. So which is it - and how do
we KNOW the answer is accurate? If it is 5 light years and we could aim
a space X-ray telescope at this star five light years away, record the
data, and then look back at the data from the GOES 10 spacecraft five
years ago and compare it, hopefully with a one hour resolution.
-
- To compare satellite X-ray data from other stars from
other areas of our universe to X-ray data from our Sun is no small undertaking.
If there is any background X-rays from our sun in the X-ray data observed
from distant stars, it could strangely render the distant star data both
useless and perhaps valuable all at the same time. It might be useless
from a science point of view if our Sun contaminates the data sets.
-
- But at the same time, it could also be valuable as it
might show a coincidence of X-ray data freezing at the same time it occurs
on distant stars. However, electron and magnetic energies which NOAA
satellites monitor are not observable at such long distances from other
stars using our current technology. X-ray observations may remain our
best option for this into the foreseeable future.
-
- Time jumps could explain some of the phenomena we see
with world weather and unexplained repeats of events in real life. The
question is will these jumps continue and if so, will they get reduce
in magnitude or become worse?
-
- Only time will tell.
-
- Ted Twietmeyer
- tedtw@frontiernet.net
- www.data4science.net
-
- I do want to thank Jeff Rense for posting this report
and others. In the science world it is highly-controversial and would
probably never see the light of day otherwise.
|