- Several weeks ago, I heard the infamous and brilliant
financial expert/stock broker Robert Chapman talk about stock market manipulation.
Robert's track record is stellar for predicting what will happen to America
economically - including revealing $80 oil several years before it happened.
Mr. Chapman is well connected and aware of the NWO plans to take over the
planet. On the radio show Robert discussed a large computer complex being
constructed near Wall St. - for the sole purpose of high frequency trading.
This type of ruthless trading can bring Wall St.to it's knees which
just might be the purpose for doing it.
-
- It was brought to my attention today that over the weekend
of Sept. 27 and 28, 2009 something had changed in the Forex (Foreign Exchange)
market. On Sept. 29 making a profit suddenly became very difficult. Normal
trading techniques that worked well in past weeks no longer seemed to work
for this particular trader. Many people who haven't been able to make money
in the stock market anymore have moved into the Forex market.
-
- Note- Forex is highly risky, and thousands of dollars
can be lost in minutes or even seconds. Do not consider or use the above
statement as a recommendation to enter the Forex market!
-
- But something has happened.
-
- I examined the Forex charts in the early morning hours
to see if a pattern was visible.
-
- Here is what I found upon examing the data. A "tick"
chart is considered the closest you can look at a currency pair which is
trading live. (This is also terminology used in looking at real time trading
charts for stocks.)
-
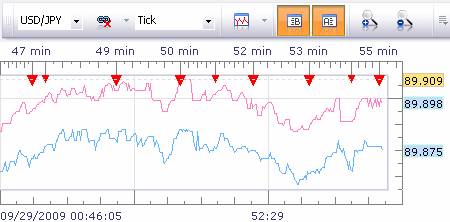
- 1. First, let's look at a normal tick chart:
-
-
-
-
-
- In the unaltered screen capture above, we can see the
small variations of normal trading as clearly defined solid lines. This
chart is for the US dollar vs. the Japanese Yen. The red line is the asking
price, or the price a trader pays for the currency pair. The blue line
is the bid price, or the price a trader gets when selling the currency
pair.
-
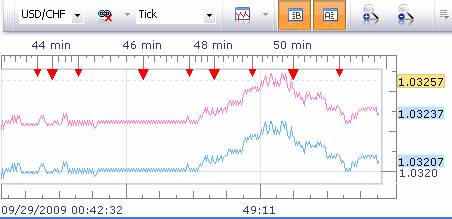
- 2. Now let's look at another currency pair which clearly
shows high frequency trading:
-
-
-
-
- In this unaltered screen capture we see a tiny square
wave super-imposed upon the normal line showing the price. Note this is
the US dollar vs. the Swiss Franc.
-
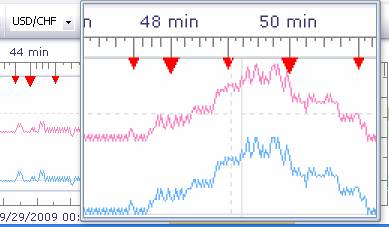
- Now let's look at the high frequency trading wave even
closer:
-
-
-
-
- In the screen capture above is part the same trading
chart magnified. It is physically impossible for anyone to trade like this
manually without the use of a specially programmed high speed computer(s)
to perform the trading.
-
- Someone would only need to manipulate one or more key
currencies to manipulate the rest. All the western world's currencies are
traded on Forex. So what's makes the Swiss Franc so special? At least one
of the banks I know of in Switzerland certainly does not have a solvency
problem - its net worth exceeds 3.5 TRILLION dollars.
-
- Now that couldn't have anything to do with Forex manipulation,
could it?
-
- Ted Twietmeyer
|